

If you are searching for how to create an alert in Splunk, then your search is over. In today’s fast-changing environment of information technology and data analysis, proactivity is an essential component of success. Simply accumulating data falls short of meeting the complicated needs of the digital era. The cornerstone of efficacy is having timely knowledge and being able to respond quickly to critical events. Splunk, an amazing and powerful data analysis and visualization tool, enters the picture.
Splunk is more than just a tool; it is a dynamic and proactive ally. In the following complete exposition, we will take a deep dive into the world of creating alerts inside the Splunk environment. What is the purpose? To provide you, the data-driven pioneer, with the tools you need to be alert and react to crucial events in your data universe.
Table of Contents
Understanding the Importance of Alerts in Splunk
Before we get into the specifics of producing alerts in Splunk, it’s important to understand why alerts are critical for any organization using the potential of Splunk.
Why Alerts Matter
Businesses rely significantly on real-time information to make educated decisions in today’s data-driven market. Splunk, with its capacity to handle massive volumes of data, delivers a goldmine of useful information. This amount of data, however, is only useful if you can quickly discover and respond to abnormalities, security breaches, or performance concerns. Alerts work as proactive sentinels, ensuring you don’t miss important happenings.
How to Create Alert in Splunk: Step-by-Step Guide
Now that we understand the significance of alerts, let’s get down to business. Creating an alert in Splunk involves several steps, each crucial for ensuring you receive timely notifications.
1. Log into Your Splunk Instance
Open your web browser, and enter the URL of your Splunk instance (here we are using 192.168.0.2:8000). Log in using your credentials. Please ensure that you have the necessary permissions to create alerts

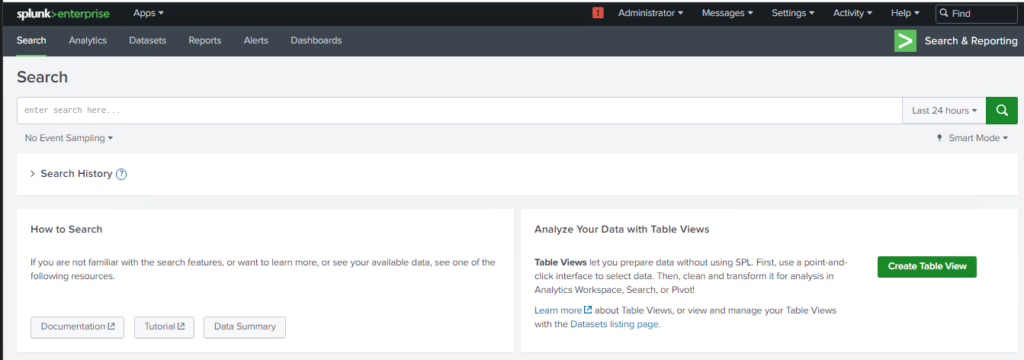
2. Navigate to the “Search & Reporting” App
Once logged in, navigate to the “Search & Reporting” app. This is where you’ll perform searches to define the criteria for your alerts.
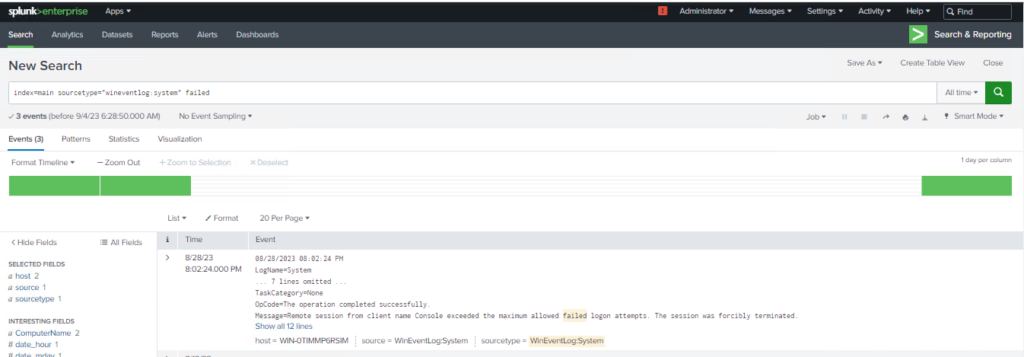
3. Construct Your Search Query
In Splunk, alerts are triggered based on search queries. You need to define the conditions under which you want the alert to be triggered. Here’s an example:
index=main sourcetype=”wineventlog:system” failed
This query looks for entries in the specified index and sourcetype where the failed keyword is used.
To learn more about the Splunk queries, click here.
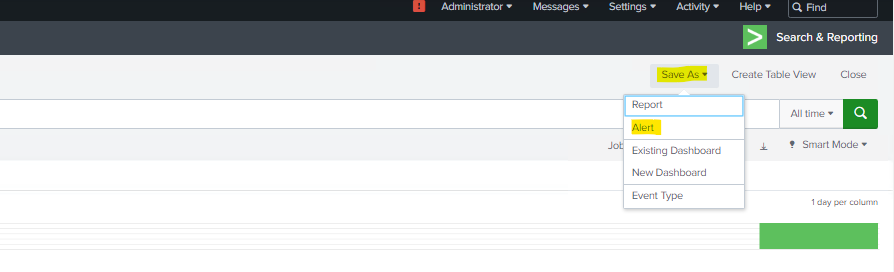
4. Save the Search as an Alert
After constructing your search query, click on the “Save As” button located near the search bar and Select “Alert” from the dropdown menu.
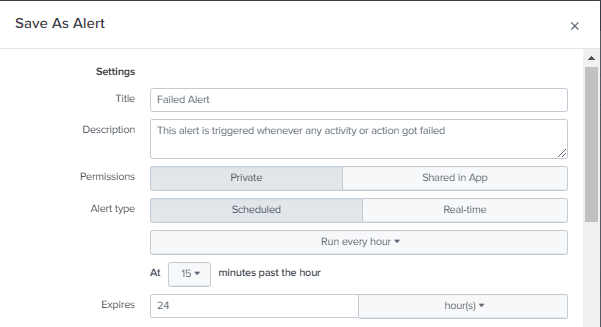
5. Configure Alert Settings
Now it’s time to configure the alert settings. This includes specifying the alert name, description, permission, alert type, and alert expire as shows below.
6. Define Trigger Conditions
In the alert configuration window, navigate to the “Trigger Conditions” section. Specify the conditions that will trigger the alert. For example, you can set thresholds for the number of events matching your search query. Scroll down to the “Trigger Actions” section. Decide what actions should be taken when the alert is triggered. Splunk offers various options

7. Configure Actions
Decide what actions should be taken when the alert is triggered. Splunk offers various options such as Add to triggered alerts, log events, run a script, etc.

8. Save and Enable the Alert
Once you’ve configured all the settings, save the alert, and don’t forget to enable it. Your Splunk instance will now actively monitor the defined conditions.
Best Practices for Creating Effective Alerts
1. Be Specific
Make your alert criteria as specific as possible. Vague alerts can lead to unnecessary noise and alert fatigue
2. Use Thresholds Wisely
Setting thresholds too low can result in excessive alerts, while setting them too high might cause you to miss critical events. Strike the right balance.
3. Test Your Alerts
Before deploying alerts in a production environment, thoroughly test them to ensure they trigger when and how you expect.
4. Collaborate with Stakeholders
Involve relevant teams and stakeholders in defining alert criteria. Their input can be invaluable in fine-tuning alerts.
5. Monitor and Adjust
Alerts should not be set in stone. Regularly monitor their performance and adjust them as needed to reduce false positives and improve accuracy.
Conclusion
In the world of data analysis and IT operations, staying ahead of critical events is paramount. Splunk’s alerting capabilities empower organizations to do just that. By following the steps outlined in this guide and adhering to best practices, you can create effective alerts in Splunk that keep you informed and proactive in managing your data. So, start harnessing the power of Splunk alerts today and gain a competitive edge in the data-driven landscape. To learn more about Splunk alerts and reports, click here.